
Post Follow Up: Finding a Psychologist in the Middle of the Desert
Will we ever stop quoting Twain?

This post is a quick follow up to my recent post here.
I just wanted to let you know that I’ll stick with this map from the APA Monitor thing and keep you updated. I also just wanted to remind you to stay alert and stay skeptical. There are multiple perspectives and ways of looking at things even in research and they have their pros and cons. Sometimes they give us useful information but they can also be misleading at times. For example, I could stand in the middle of the 3,472 square miles of Yellowstone National Park and say “geesh, almost no one lives here for a good chunk of the year” and a statistical method/computer could say “geesh, there are an average number of psychologists around that someone could access here.” Likewise for the entire state of Montana which has a huge land mass covering 56 counties but only 222 licensed psychologists. The map says there is average access to psychologists in the entire state of Montana. Apparently I only know elementary school math but if I assigned one licensed Montana psychologist to work in each county I could only get less than 4 per county and nothing close to the 34 per county average noted (and you and I both know many of them are more likely to be in cities). I’m interested to see how far APA’s analysis expects people to drive to see a psychologist; for example, it is possible that 34 centrally located psychologists might be expected to serve and incredibly disproportionate percentage of a states’ population which would sound ridiculous to anyone but a computer. The same methodology APA uses apparently can say there is a “Very high concentration” of psychologists in a county in New York State where there are actually zero psychologists. Good stuff.
Also, we should be careful about equating “average” with adequate. In addition, labels being used on the map like “Very high concentration” do not necessarily mean “more than enough” or “saturated,” particularly given that we see a county in New York State with ZERO psychologists that has been labeled as having access to a “Very high concentration” of psychologists.
I’ll keep you up to date when more information comes in but check out the clarifying emails I received so that you can have all the sides and not just my rant; I’ve copied and pasted the emails below for you:
From: toddfinnerty@toddfinnerty.com [mailto:toddfinnerty@toddfinnerty.com]
Sent: Thursday, February 25, 2016 3:19 PM
To: APA Center for Workforce Studies
Subject: Just a thought
It seems a bit awkward that the county-level map on pg 13 of the March Monitor makes it look like Yellowstone National Park, a very large area, has an “average” level of psychologists 😉
Todd Finnerty, Psy.D.
——– Original Message ——–
Subject: RE: Just a thought
From: “Lin, Luona” <LLin@apa.org>
Date: Fri, February 26, 2016 10:00 am
To: “toddfinnerty@toddfinnerty.com” <toddfinnerty@toddfinnerty.com>
Cc: APA Center for Workforce Studies <CWS@apa.org>
Dear Dr. Finnerty,
Thanks for contacting us and for your comments on our most recent Datapoint.
The map was based on the statistical comparison of county-level psychologists to a national average level of 34 licensed psychologists per county. The distribution of licensed psychologists in the Yellowstone National Park area was indeed not statistically different from this level and therefore no “hot spot” or “cold spot” was identified there. We originally had the average level (34 licensed psychologists per county) specified in this Datapoint, but we deliberately took it out as this number masked the vast geographic differences in the distribution of licensed psychologists across the country.
We will have a larger report focusing on the county-level distribution of licensed psychologists to be released on our website in March. Thanks for your interest in this Datapoint, and please stay tuned for the report!
Sincerely,
Luona Lin
Luona Lin, MPP | Research Associate
Center for Workforce Studies
Education Directorate
American Psychological Association
750 First Street NE, Washington, DC 20002-4242
Tel: (202)336-6023
Email: llin@apa.org
From: Dr. Todd Finnerty [mailto:toddfinnerty@toddfinnerty.com]
Sent: Friday, February 26, 2016 10:54 AM
To: Lin, Luona
Cc: APA Center for Workforce Studies
Subject: RE: Just a thought
Thank you again for your response an I’ll spare you all the various other references to parks I could make on the map like Death Valley in California or Baxter State Park in Maine (both of which appear to have a Very high concentration of psychologists on your map).
I had one other question. Could you help me understand the map in New York State? The entire state appears to be colored red for Very high concentration. I think that what I’m seeing here on this website is a geographic distribution of psychologists by county in NYS: http://www.op.nysed.gov/prof/psych/psychcounts.htm
One of the counties in NY appears to have zero psychologists (and others have single digits). Could you help me understand how a county that may have zero psychologists appears on the map as a “Very high concentration” given the note that 34 per county was the average? Thank you again for your help,
Todd Finnerty, Psy.D.
——– Original Message ——–
Subject: RE: Just a thought
From: “Lin, Luona” <LLin@apa.org>
Date: Fri, February 26, 2016 11:39 am
To: “Dr. Todd Finnerty” <toddfinnerty@toddfinnerty.com>
Cc: APA Center for Workforce Studies <CWS@apa.org>
Dr. Finnerty,
Thanks for following up with us. The results came out differently because this map does not represent the exact number of licensed psychologists in each county, but rather presents the national pattern through hot spot analysis.
The statistical comparison based on the Getis-Ord statistic from hot spot analysis is not a t-test between each county and the national average, but a geographic analysis that accounts for all of the following: (1) the number of licensed psychologists in the county, (2) the number of licensed psychologists in the surrounding counties, as well as (3) the distance between the surrounding counties and the county of interest. With this analysis, we identify concentration of counties with high values (hot spot- more licensed psychologists) and low values (cold spot- less licensed psychologists).
Take your case, Seneca county in New York, for example, it has no licensed psychologists- which is the case with our records from state licensing board list too. However, most of the surrounding counties of Seneca county have higher number of licensed psychologists; and with the smaller county size, their distance to Seneca county is also small. Therefore, even though there is zero psychologist in Seneca county, It’s just one county, it does not form a “concentration” of low values in the area, and was therefore not identified as a “cold spot” in our analysis.
Similarly, most national park areas may have low number of licensed psychologists, but it does not necessarily indicate that there is a statistical “cold spot.” In the case of the Yellowstone National Park, which I was checking just now, there are altogether at least 50 licensed psychologists in the area (Park county, Teton County, WY; Gallatin County, Park County, MT)- which is not as low as expected- and considering the surrounding counties have fairly average number of licensed psychologists (approximately 20-30 licensed psychologists per county), it was not identified as a cold spot.
For more information on Getis-Ord statistic and hot spot analysis, please refer to the link: http://resources.esri.com/help/9.3/arcgisengine/java/gp_toolref/spatial_statistics_tools/how_hot_spot_analysis_colon_getis_ord_gi_star_spatial_statistics_works.htm
As I mentioned, this map was designed to present a national pattern instead of local, county-level patterns. In our report, however, we also included maps presenting the number of licensed psychologists as well as the number per capita, at the national level and specifically the state of New York, which will present more geographic detail. I will send you a link of the report once it is published.
Again, thank you for your interest in our Datapoint and the report! I hope this clarification helps.
Sincerely,
Luona
Luona Lin, MPP | Research Associate
Center for Workforce Studies
Education Directorate
American Psychological Association
750 First Street NE, Washington, DC 20002-4242
Tel: (202)336-6023
Email: llin@apa.org
XXXXXXXXXXXXXXXXXXXXXXXXXXXXXXXXXXXXXXXXXXXXXX
Anyway, like I said I’ll keep you up to date.
Thanks again,
Todd Finnerty, Psy.D.
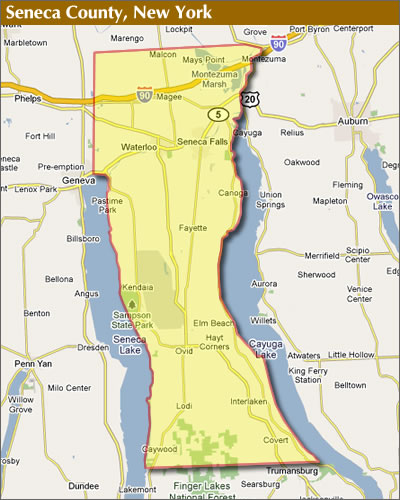
P.S. I grew up in upstate NY so I’m familiar with the geography. Seneca County, NY is bordered on the east and west by Finger Lakes. Since there appears to be no psychologist in the county they’d probably have to drive quite a ways in an annoying fashion to find one (yet it is labeled Very high concentration).
Oh well, I suppose it would prove they were motivated if they had to swim across a lake every week for their psychotherapy session (or more realistically drive far depending on where they are in the county) P.P.S. Psychologists– the Finger Lakes are beautiful wine country and you may wish to consider moving there despite their being a “Very high concentration” of psychologists (though apparently you’d be the only psychologist in Seneca County).
Another issue is that a large VA is nearby (Canandaigua) and I’m willing to bet you donuts that a large percentage of the nearby psychologists work there and a much smaller percentage are available for the general community.